


.gif)


Makerble integrates with Mailchimp, Google Drive, Google Calendar, Gmail and more. You also gain access to Makerble’s open API which gives you the freedom to connect your data to your own software applications.

.png)


.png)


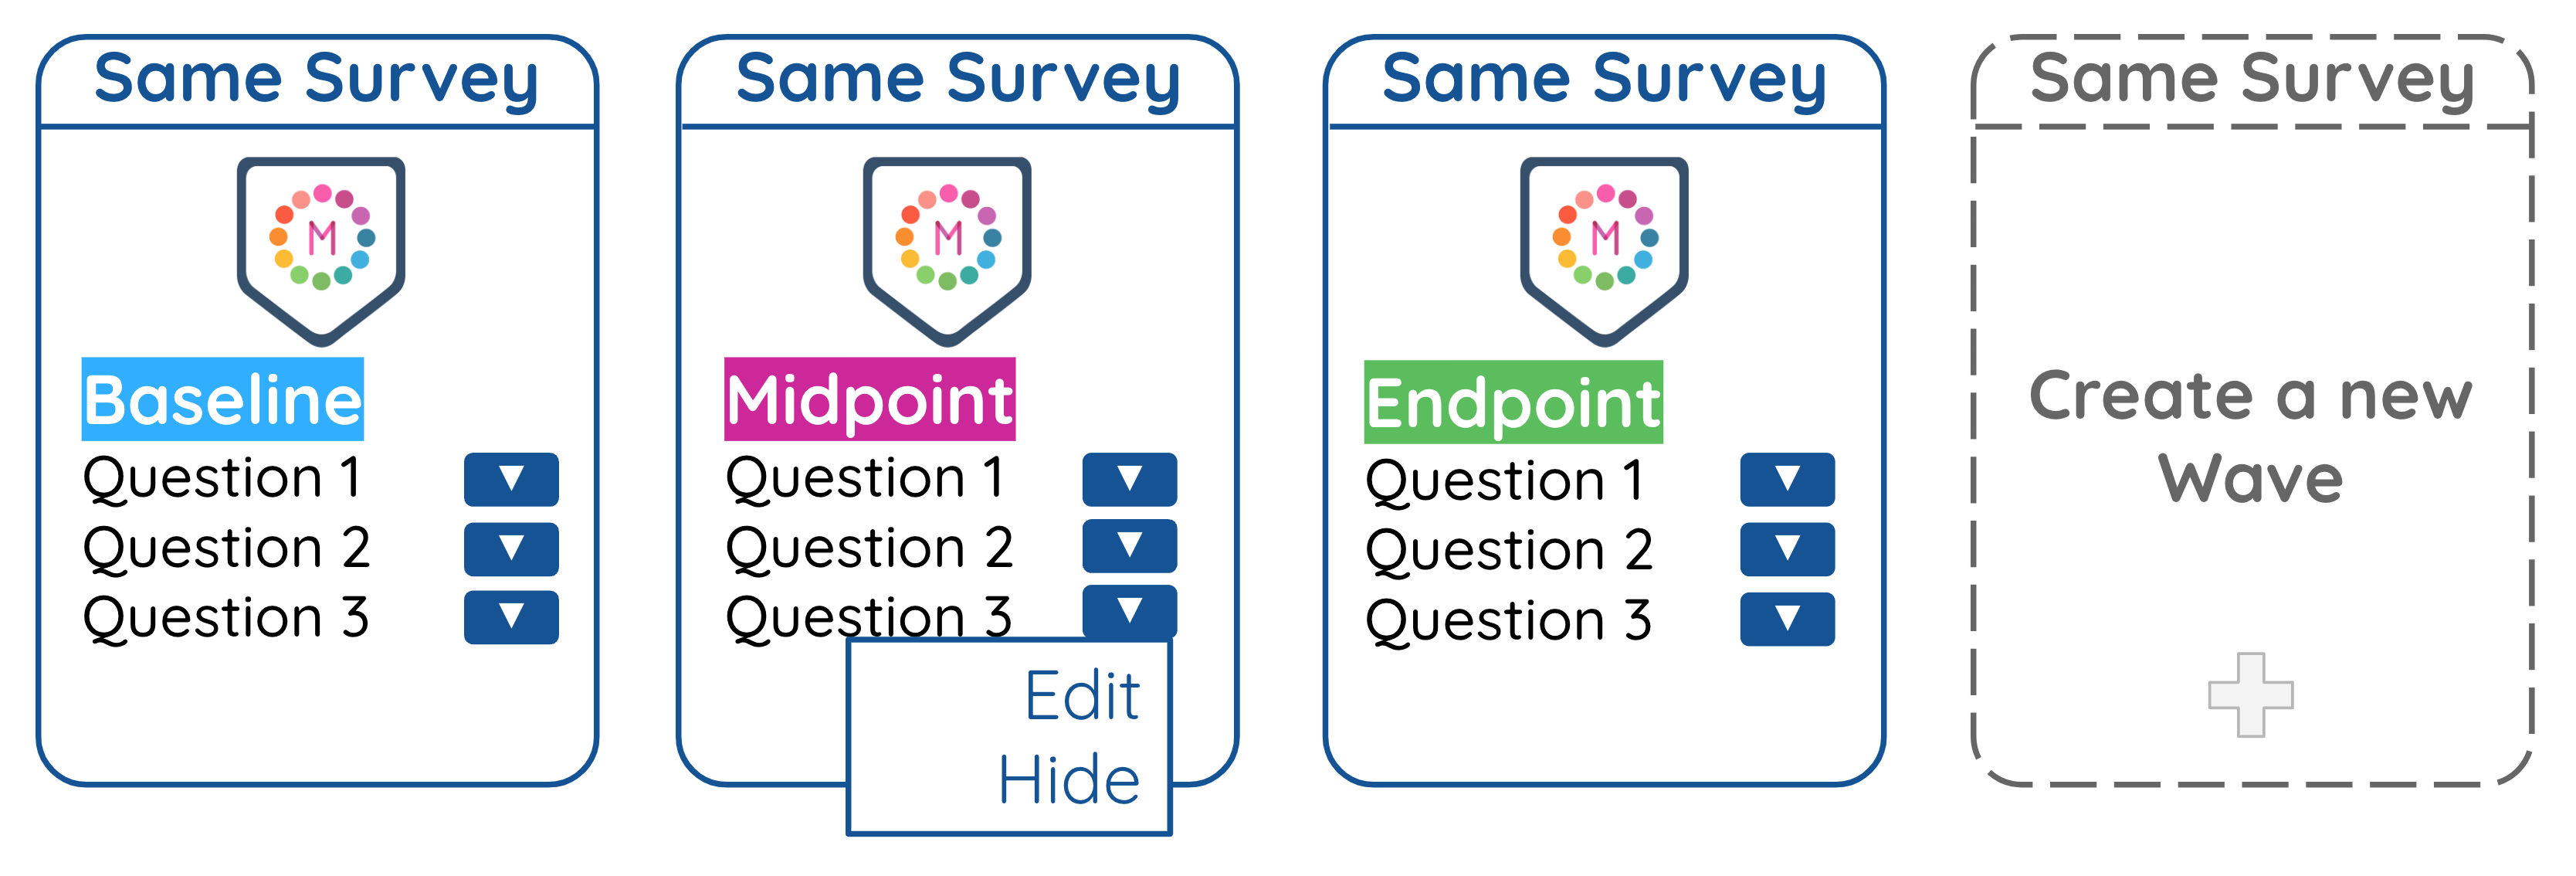
Assign survey permissions, control visibility and work together across departments and projects. Get consent, anonymise responses when needed and uphold ethical research standards.


.png)
.png)

.png)

.png)


