

Get more out of your surveys. Save time with automations, improve the survey completion experience and expand the range of insights available from your responses. Discover all this and more in our round up of the top 12 ways to supercharge surveys on Makerble. Let's dive in.
#12 Skip Logic
Increase survey completion rates by ensuring that respondents only see the questions that relate to them. Skip Logic enables you to tailor the survey experience to each respondent based on their answers to your questions. You can categorise some of your survey questions as screening questions which means that the answers to those questions dictate which subsequent questions are displayed to a respondent.
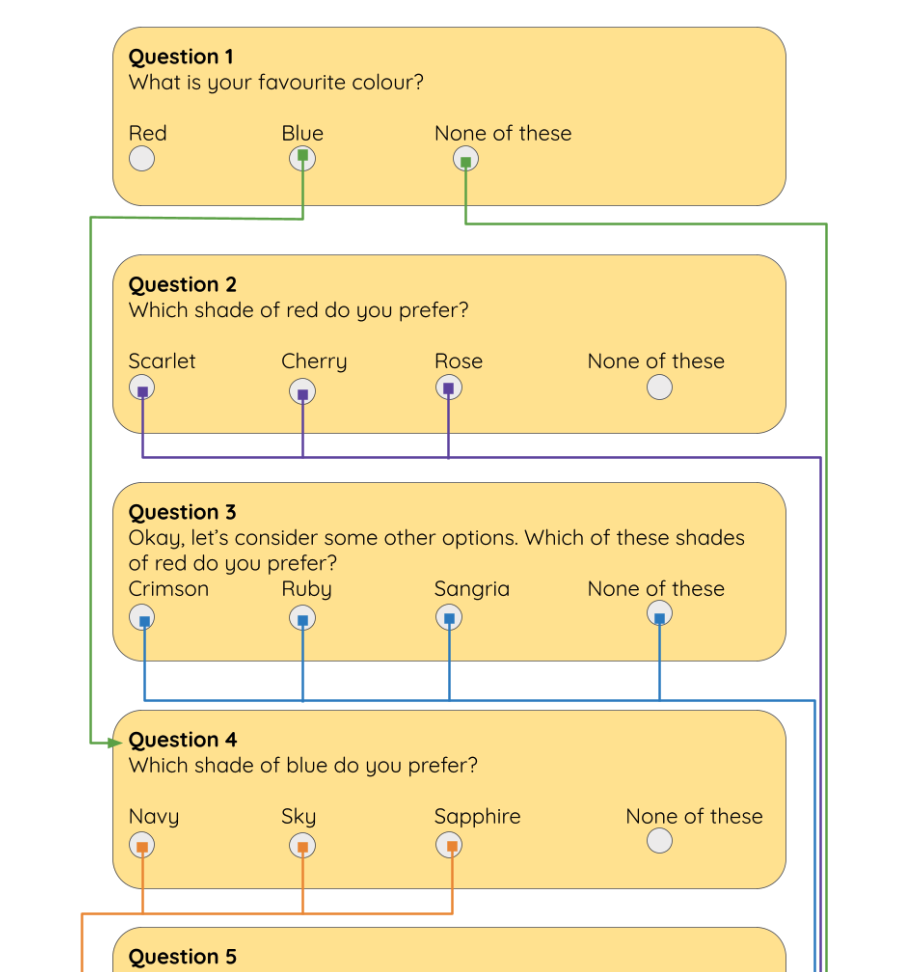
There are two types of Skip Logic available to you on Makerble Surveys.
- Basic (Jump To Question) will immediately skip past one or more questions based on the answer that the respondent has just provided to a question
- Advanced (Hide Question Unless...) will remember a respondent's answer to an earlier question and based on that earlier answer, it will show or hide a question which appears later in the survey
Skip Logic is a great way to manage complex data collection requirements without needing to complicate things by creating many different surveys that are only slightly different from each other. It lets you consolidate all your questions into a single survey that uses screening questions to guide respondents to the parts that are relevant to them.
#11 Success Scores
Success Scores give you an instant understanding of the change in people's answers between their pre and post survey responses. There are three scores and each one is automatically calculated for every Scale-based question set to Single Choice. This means you can speed up your longitudinal analysis, report accurate results quickly and see at a glance how well a particular cohort is doing.

The Success Scores show you the following:
- the % of contacts or survey respondents who have improved (in other words, Distance Travelled)
- the average amount of improvement across all contacts
- the % of the way there - a current snapshot of progress across all contacts
Now you can get an understanding of Distance Travelled without needing to review every respondent's answer on every survey they've completed.
Find out more about Success Scores
#10 Question Rotation
There's always a trade-off with longitudinal surveys between consistency and variety. Question Rotation on Makerble gives you the best of both.
Here's a quick rundown of how it works:
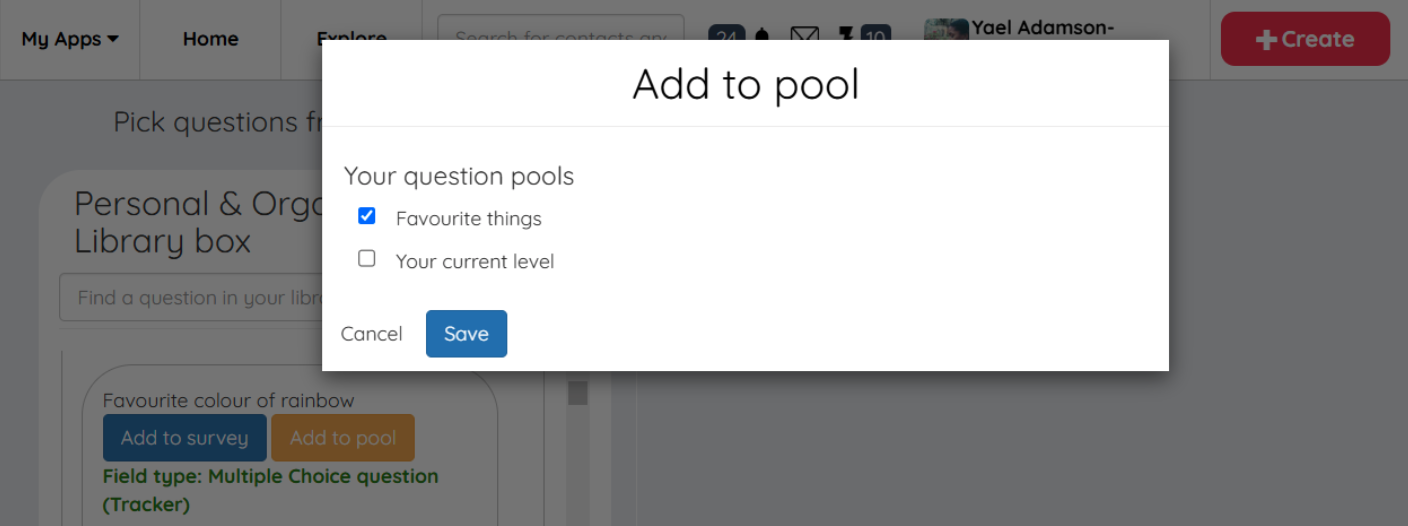
- By default your questions are static - which means that they will appear in a survey every time that it is completed.
- But for questions that don't need to be asked as frequently, you can add them to a Pool.
- Every time someone is shown the survey to complete, they will see a different question to the one they saw last time from that Pool.
- You can add as many Pools as you like to each survey.
This lets you rotate the questions which are being asked in order to give respondents a degree of variety, whilst at the same time being able to maintain consistency where you need it.
Get started with Question Rotation
#9 Automated Survey Distribution
Send out personalised survey invitations, on time and with accuracy, using Makerble Automation. Set rules that govern when people are sent specific surveys, such as a feedback survey at the end of a course or a baseline survey once they register with you. Intelligently customise the email and SMS message containing the survey link using mail merge tags that give every communication the personal touch, even as you scale.

Automated Survey Distribution is particularly useful when you have a constant influx of people whom you need to ask questions. Do you have
- new customers or enquiries every day?
- new courses every couple of months?
- new cohorts of students every academic year?
- new employees ad-hoc?
If you need to deal with any of these, sending out one-off survey links quickly becomes tricky. If you need to go beyond that and collect survey responses from the same people over time - such as a Pre and Post survey - it can become a nightmare to administer all those survey invitations. Makerble Automation can simplify it all. Now your team can focus on what they do best - coming up with ways to better serve your audience rather than getting bogged down in survey administration.
Get started with Automated Survey Distribution
#8 Verdicts
Every survey response means something, but interpreting the meaning can take time. Verdicts on Makerble allow you to automatically classify every survey response based on the combination of answers chosen. This speeds up decision-making when it comes to deciding what to do next with a participant once they've completed a survey.
Verdicts are typically used in medical scenarios where a particular set of answers indicates a specific diagnosis. But you can create your own decision-making formulas that enable you to intelligently classify each participant based on their answers to your questions.
#7 Response-based Workflows
When people don't respond
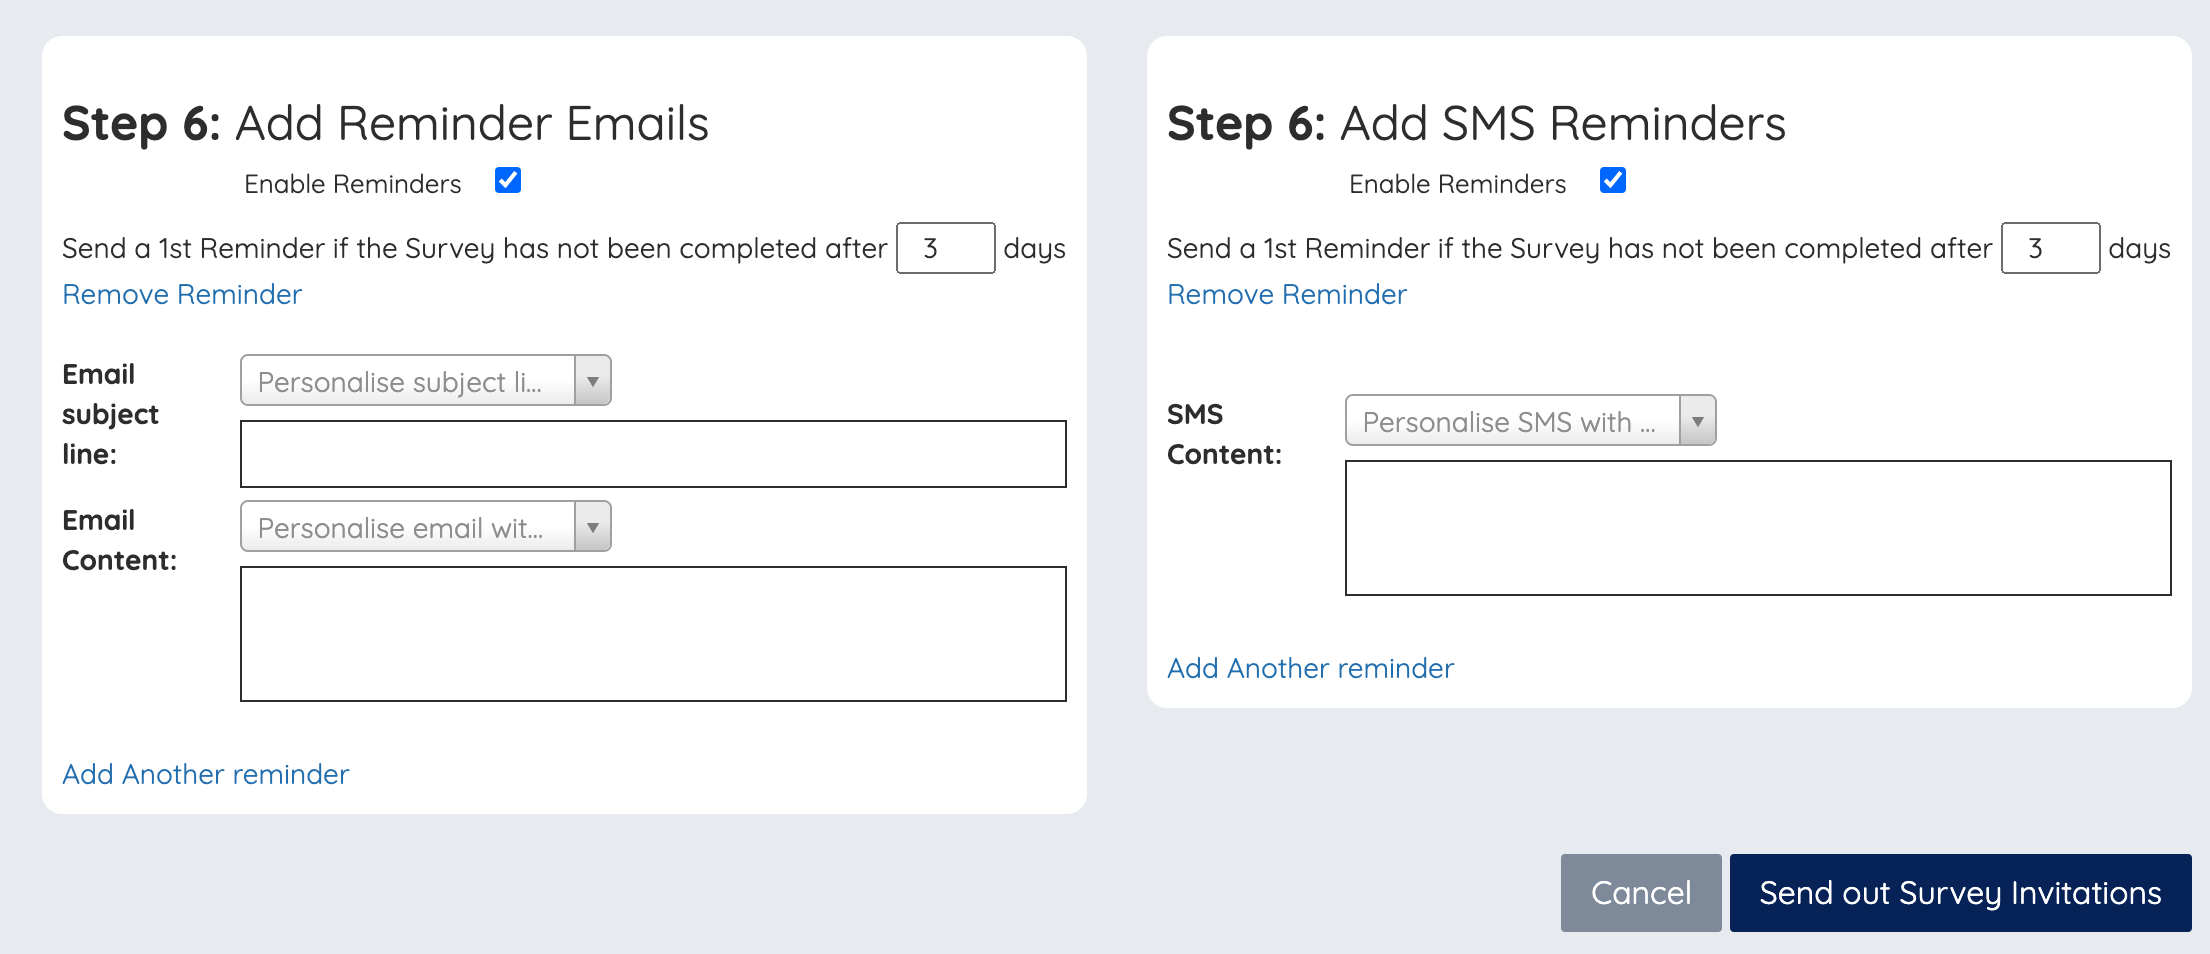
Increase your survey's response rate with automated reminders that chase people up, only if they haven't submitted their survey response yet. We all know that chasing people up can be tedious and there's all the administration involved - cross-checking your submissions list with your distribution list. With No-Response Reminders you can sit back and watch the survey responses roll in.
Get started with No-Response Reminders
When people do respond
Take action in response to people's answers. Answer-based Workflows allow you to deliver personalised interventions based on the way people have answered your survey. For example - if a respondent has mentioned a particular opportunity or risk (e.g. being ready to look for a new job) you can automatically alert relevant colleagues, add a flag to their contact profile or even send them personalised communications via SMS and Email. In this way you can act on every survey response in real-time; improving risk management and capitalising on time-sensitive opportunities.
Get started with Answer-based Workflows
#6 Outcome Rings
Outcome Rings turn individual survey responses into a clear visual story that makes it easy for everyone to understand the shape of the results. Outcome Rings display a person's answers to related survey questions on a 'spider plot' which reveals strengths, gaps, and overall patterns at a glance.

As a visual aide, Outcome Rings help everyone make sense of progress. This means you can use them as an engagement tool when working with individual respondents or an entire group of respondents. Rather than requiring people to interpret tables with words and numbers, you can instead empower them with visuals that highlight just how far they have come, while at the same time pinpointing areas for further growth. This makes Outcome Rings a dynamic and interactive diagnostic tool. Now you can transform raw data into meaningful insights that drive personal development and honest group discussions.
You're not limited to looking at individual participants on Outcome Rings. You can also see and overlay the following:
- the Mean Average response from an entire cohort of participants
- Observations recorded by your colleagues about participants
- Self-reflections submitted by participants themselves
Get started with Outcome Rings
#5 360° Surveys
Create a culture of openness and embed a Growth Mindset, with 360° Surveys. You can collect several people's perspectives on the same person or organisation by categorising your respondents as Observers. This is useful when you want to:
- Provide employees with rich rounded feedback from their peers about how they're doing - you designate one employee as the 'subject' and the other employees are linked to them as 'observers'
- Conduct an OCAT (Organisational Capacity Assessment Tool) survey that gathers feedback about an organisation or team from across the workforce or team-members, in order to assess how the organisation is really doing - you designate the organisation or team as the 'subject' and the the workforce or team members are linked to them as 'observers'
In each of these scenarios you can use Outcome Rings to compare and contrast what Subjects say about themselves with what Observers say about them. This can lead to honest and fruitful feedback and reflections that drive progress.
#4 Tabulated Interval Analysis
One of the best ways to track improvement is to compare survey responses collected over time from the same respondents. This enables you to establish a baseline and then see how responses vary. Each point in time is an Interval and you can even give each Interval a name so that it's easier to identify them in your analysis.

Makerble gives you several ways to conduct Interval Analysis. If you prefer a more visual interface you can instead opt for the chart-based dashboards.
- Tabulated responses that are ordered sequentially i.e. 1st Time, 2nd Time, 3rd Time
- Tabulated responses that are ordered according to each named interval e.g. baseline - midline - endline
Get started with Interval Analysis
#3 Multi-version surveys
Tweak your survey questions over time, without needing to create duplicate questions. Survey Versions on Makerble give you the freedom to adapt and adjust your surveys as you go, whether that's based on changes to research requirements, feedback or any other reason.
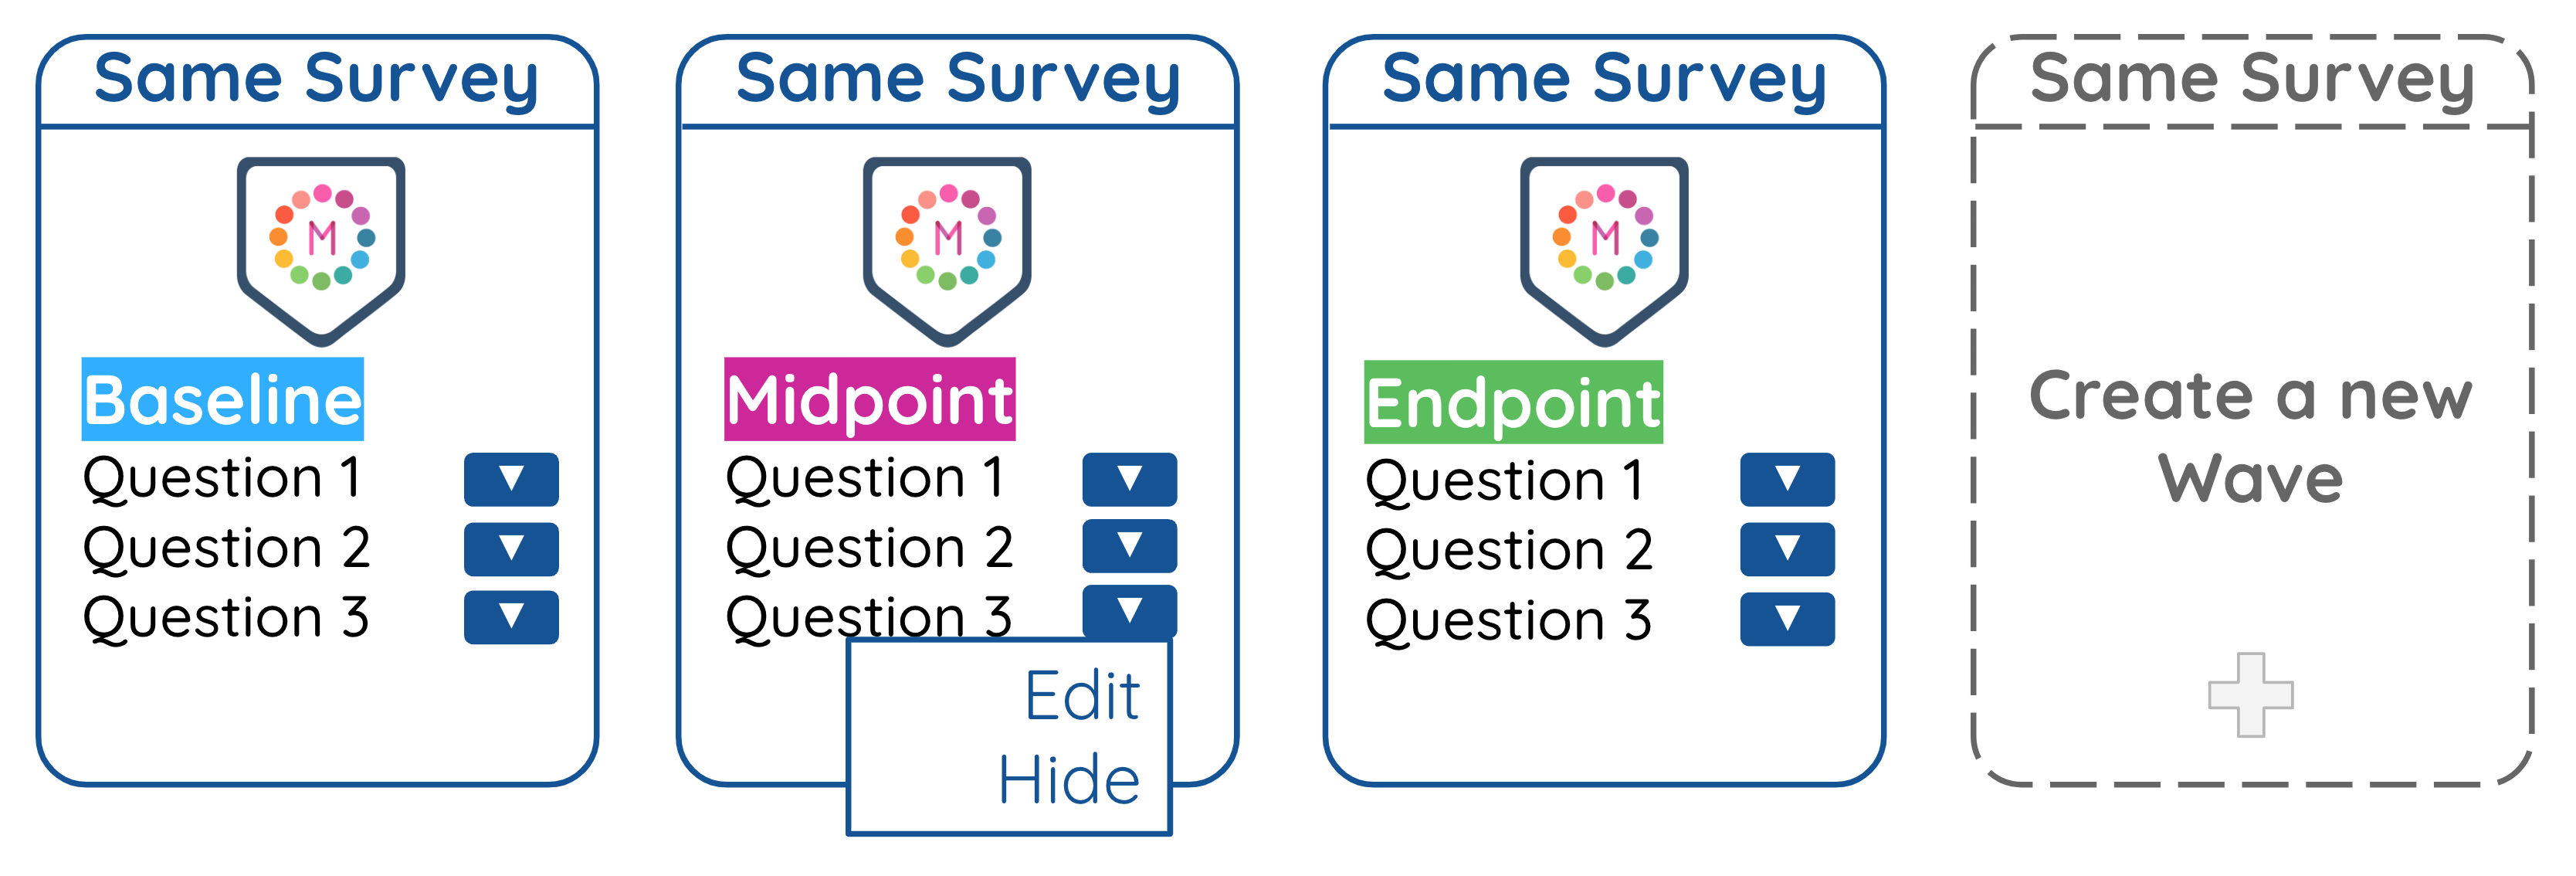
Each of your surveys contains Core Questions which you can choose to hide, reword or keep in subsequent versions of the survey. This means you can still compare responses - for longitudinal analysis, such as when you have a baseline, midpoint and endpoint - and you can aggregate responses to see the totals across different projects, even though the survey questions themselves might be worded slightly differently or only appear in certain versions.
Get started with Mult-version surveys
#2 Benchmark Comparisons
Understand how one cohort performed compared to another. Contrast contacts with one characteristic versus contacts of another. See how results from one year differ from results from another. You can do side-by-side comparisons like these and more using the Comparison features available on Makerble.
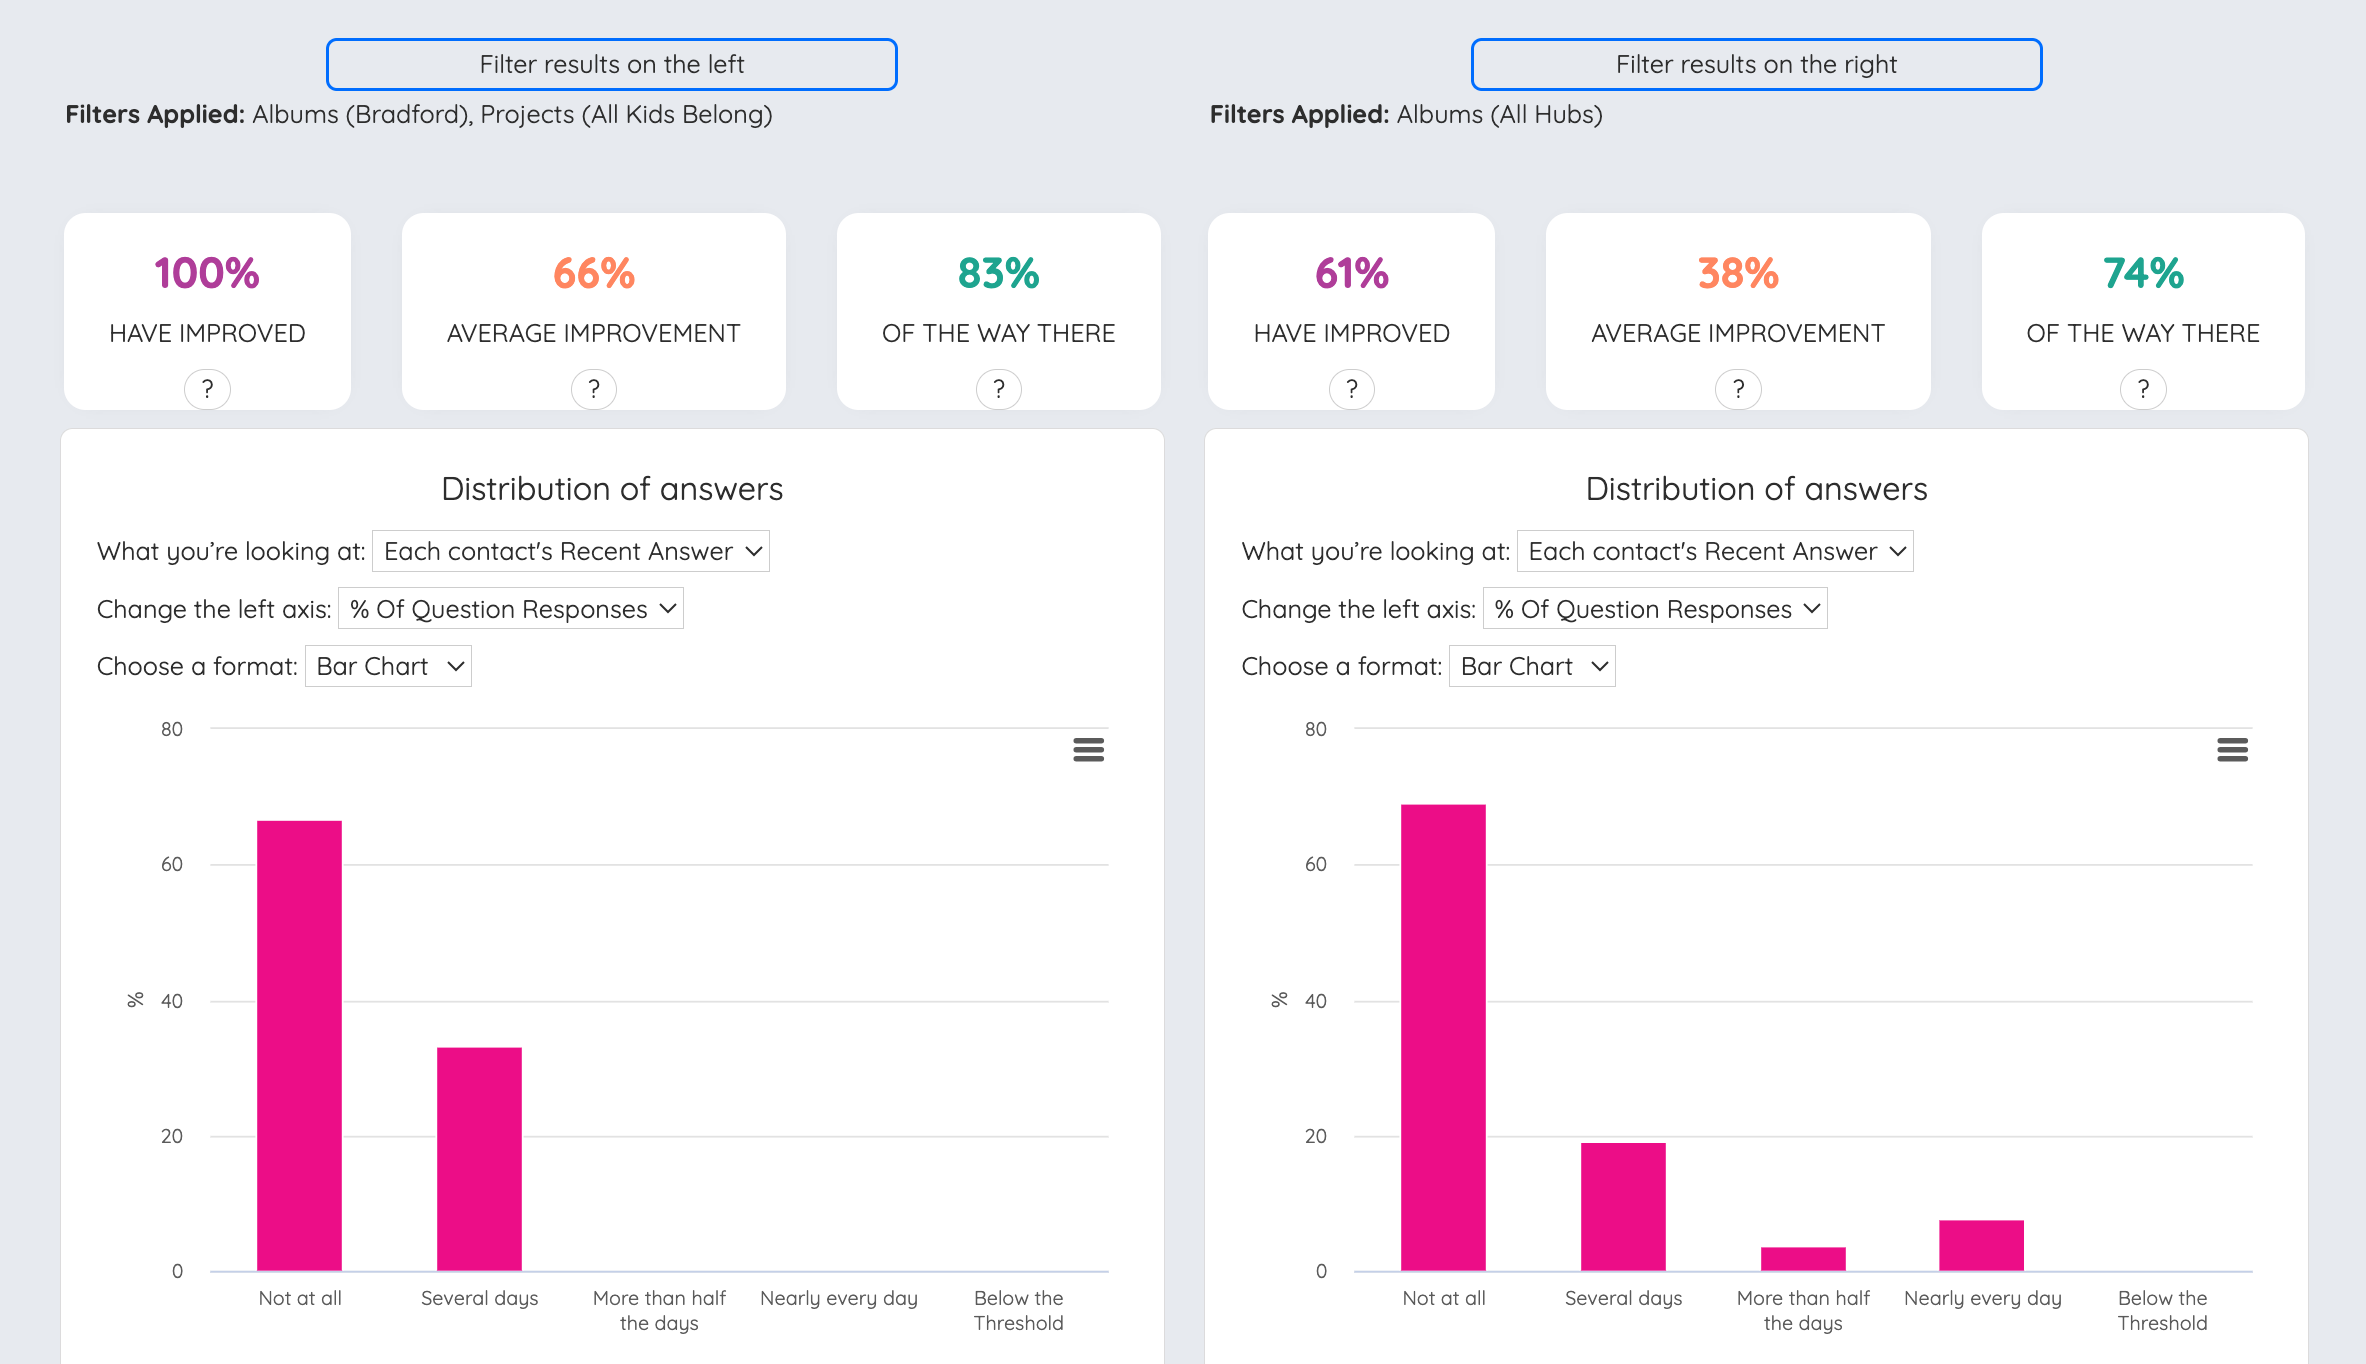
One definition of impact is the difference you've made compared to what would have happened anyway. With Benchmark Comparisons on Makerble you can create your own benchmarks to compare results against and if you're running a control group or even a randomised controlled trial, you can manage your results on Makerble and see the differences between both groups easily.
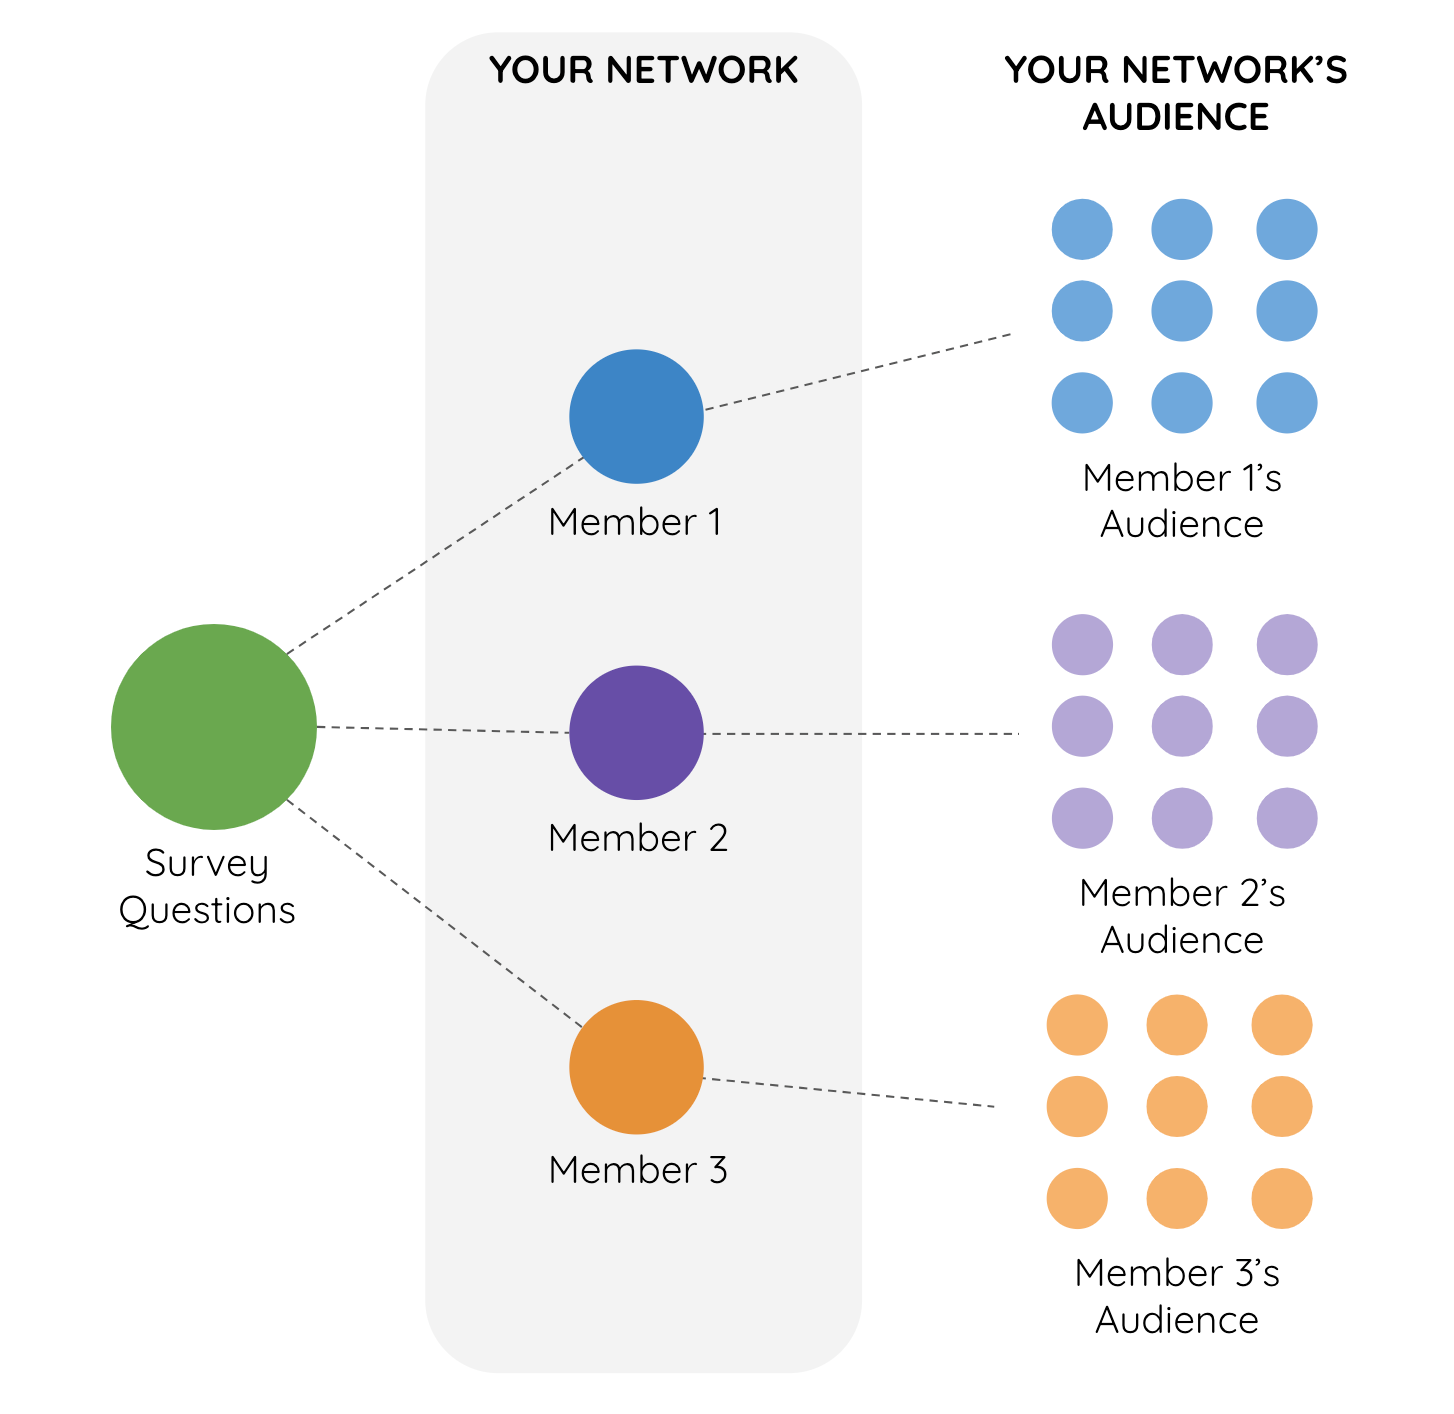
#1 Branded Survey Microsites
Lead the conversation in your sector with a Branded Survey Microsite. You create the surveys, give your members access to their private dashboard and then they share survey links with their audiences. They get to analyse only their results, whereas you get to see anonymised results from across your members' audiences.
Armed with those insights you can see the big picture of what's happening in your sector. You have full access to the dashboards that let you identify themes and spot trends. You can even share your benchmarks so that members can compare their results against your benchmark and see how their own results change year-on-year.
Get started with Branded Survey Microsites
So that's it - a summary of all the ways you can get the most out of your surveys and ensure you gain the insights you need for growth. To put these into practice, start using Makerble Surveys for free or to dive deeper with a specialist, book a call.


.png)

%208.png)


.png)


